


What are social impact metrics?
Social impact metrics are defined measures of what a program delivered and what changed for the people and communities it serves. Each one names who is counted, what qualifies, when and from which source, so the number means the same thing every time.
There is no universal list every program should adopt. A membership network, a training provider and a grantmaker pursue different changes, so start from the decision and the people affected, then pick the few measures that answer it.
THE SHORT VERSION
- Choose a short set that pairs a few outputs with the outcomes you expect, plus who was reached and what could go wrong.
- Tag each metric with the Five Dimensions of Impact, and add an IRIS+ code only when your definition truly matches it.
- Write every metric as a dictionary row before collecting, so numbers from different sites or partners can be added honestly.
What types of social impact metrics are there?
Six types cover most needs: resources, outputs and reach, quality and experience, outcomes, distribution, and unintended effects. Outputs say what you did and outcomes say what changed; the other four help you read both fairly.
Scroll horizontally to see all columns →
| Metric type | Example | Use it carefully |
|---|---|---|
| Resources | Staff hours assigned to delivery | Spending is not evidence of benefit |
| Outputs and reach | Unique participants, sessions, completions | Count people, not attendances |
| Quality and experience | Reported usefulness of support | Satisfaction is not lasting benefit |
| Outcomes | Skill gained, job kept, condition improved | State definition, window and source |
| Distribution | Differences across groups | Check group sizes and privacy |
| Unintended effects | Burden, exclusion, harm reported | Report it rather than omit it |
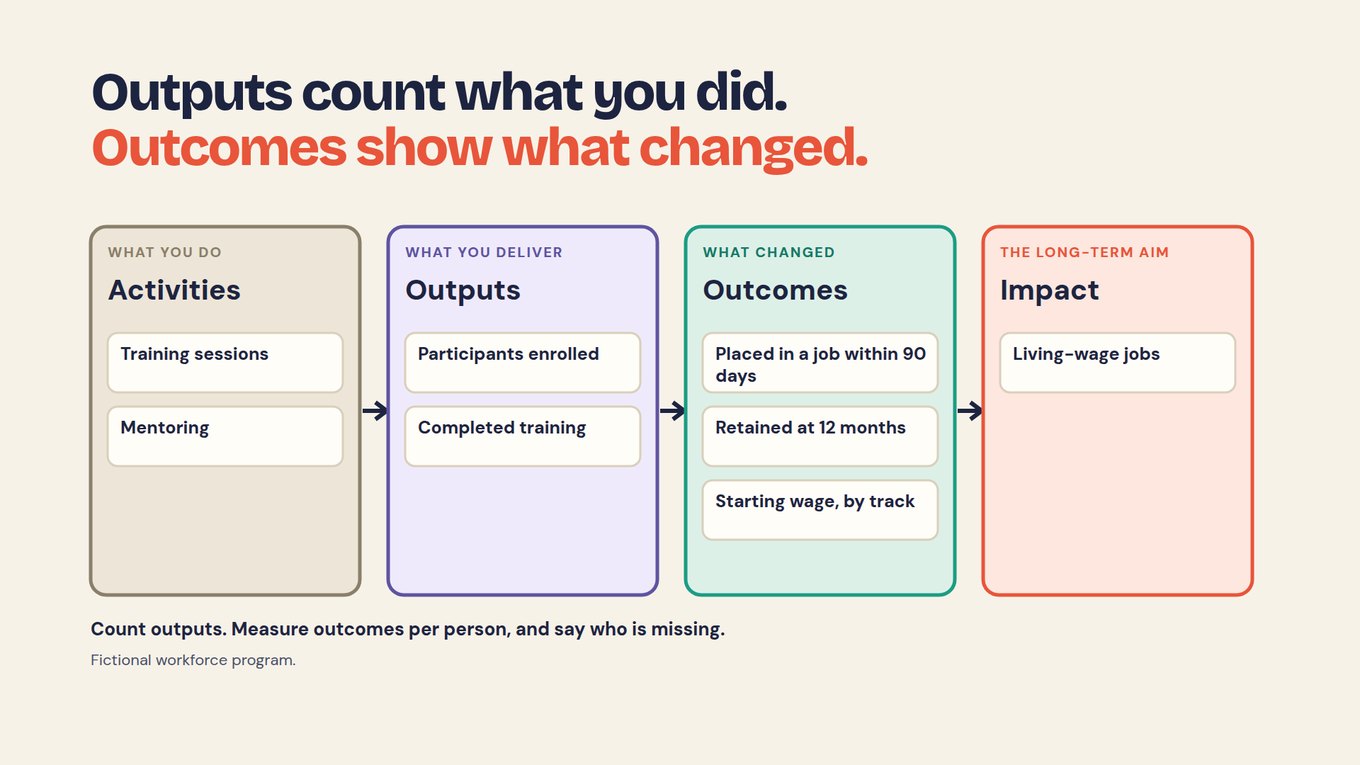
The course's fictional workforce program shows the two central types side by side. Training sessions and mentoring are activities; participants enrolled and completed training are outputs; placement within 90 days, retention at 12 months and starting wage by track are outcomes.
Group-level and anonymous measures are fine when their limits are stated; see impact measurement for choosing a design.
What are examples of social impact metrics by sector?
Use examples as starting points, not as a scorecard to adopt whole: for each workflow, pick one delivery measure and the outcome measure that matches the change the program exists to cause. Adapt the wording with the people who do the work and the people it serves.
Scroll horizontally to see all columns →
| Workflow | Delivery measure | Outcome or experience measure |
|---|---|---|
| Training and professional development | Completion against an agreed course requirement | Demonstrated skill, or later use of it at work |
| Membership and networks | Member organizations taking part in an activity | Reported usefulness or use of shared learning |
| Employment support | Participants receiving the defined support | Job starts, retention or job quality at set follow-ups |
| Partner and supplier development | Partner sites completing agreed actions | A relevant practice adopted and kept |
| Grant portfolios | Grants or programs with usable reporting | Program outcomes, added up only where definitions match |
| Community initiatives | Reach of the intended service | Community conditions or experiences, with suitable methods |
Watch the vague ones. “Members engaged” could mean opening an email, attending an event, answering a survey or taking action; each may be useful, but swapping one for another changes the finding.
The short video below separates delivery from change before you choose. Watch for the rules that turn an output count into an outcome metric measured per person.
How do you choose social impact metrics?
Start from the intended change and the decision the numbers must inform, then keep only the metrics your team and partners can collect and will use. Seven steps, in order:
- Name the intended change. Connect it to the theory of change or another reasoned account of the work.
- Name the decision and the reader. Who will act on the number, and what are they unsure about?
- Check relevance with the people affected. A convenient indicator can miss the change they care about.
- Balance delivery and outcomes. Keep enough output counts to explain results without letting counts crowd out change.
- Weigh feasibility and burden. Use existing sources where they fit; collect only what someone will use.
- Define and test. Try the question, the calculation and the report view on a few records first.
- Assign an owner. Name who checks quality, interprets results and approves changes.
The result for the course's fictional regional workforce fund, which funds four job-training partners, is five agreed metrics: two outputs and three outcomes.
Scroll horizontally to see all columns →
| Metric (fictional) | Type | Dimension | Standard |
|---|---|---|---|
| Participants enrolled: unique people, quarterly | Output, reach | How much · Who | IRIS+ PI4060 |
| Completed training | Output | How much | None mapped |
| Placed in a job within 90 days of exit | Outcome | What · How much | None mapped |
| Retained: same job at 12 months | Outcome | How much · Risk | None mapped |
| Starting wage: hourly, by track | Outcome | How much | None mapped |
No metric answers Contribution, the program's part in the result: a gap to write down, not a reason to add metrics nobody will collect.
How do IRIS+, the Five Dimensions and the SDGs fit?
They answer different questions. The Five Dimensions say what kind of evidence a metric is, IRIS+ offers shared definitions with codes, and the SDGs name the global goal a program relates to; none makes two different definitions comparable.
Impact Frontiers maintains the Five Dimensions: What, Who, How much, Contribution and Risk. Tag each metric with the one or two it answers, as in the table above, and the gaps in your set show themselves.
The GIIN's IRIS+ catalog holds qualitative and quantitative metrics used by impact investors. Read the metric's own definition before claiming alignment, and note any difference, such as a 90-day window the standard does not use.
The UN Sustainable Development Goals give context; an SDG label does not show that a program achieved anything.
The video below shows one data dictionary whose rows map to IRIS+, the SDGs and ESRS at once, so the same metric is not rebuilt for each framework. Watch for where the framework label attaches: to the definition, not to a separate spreadsheet.
How do you turn each metric into a definition?
Write one dictionary row per metric before the first answer is collected: the metric, its plain definition, its dimension, an optional standard and the rule for adding it up. Each row also records the collection point, data type, disaggregation and source.
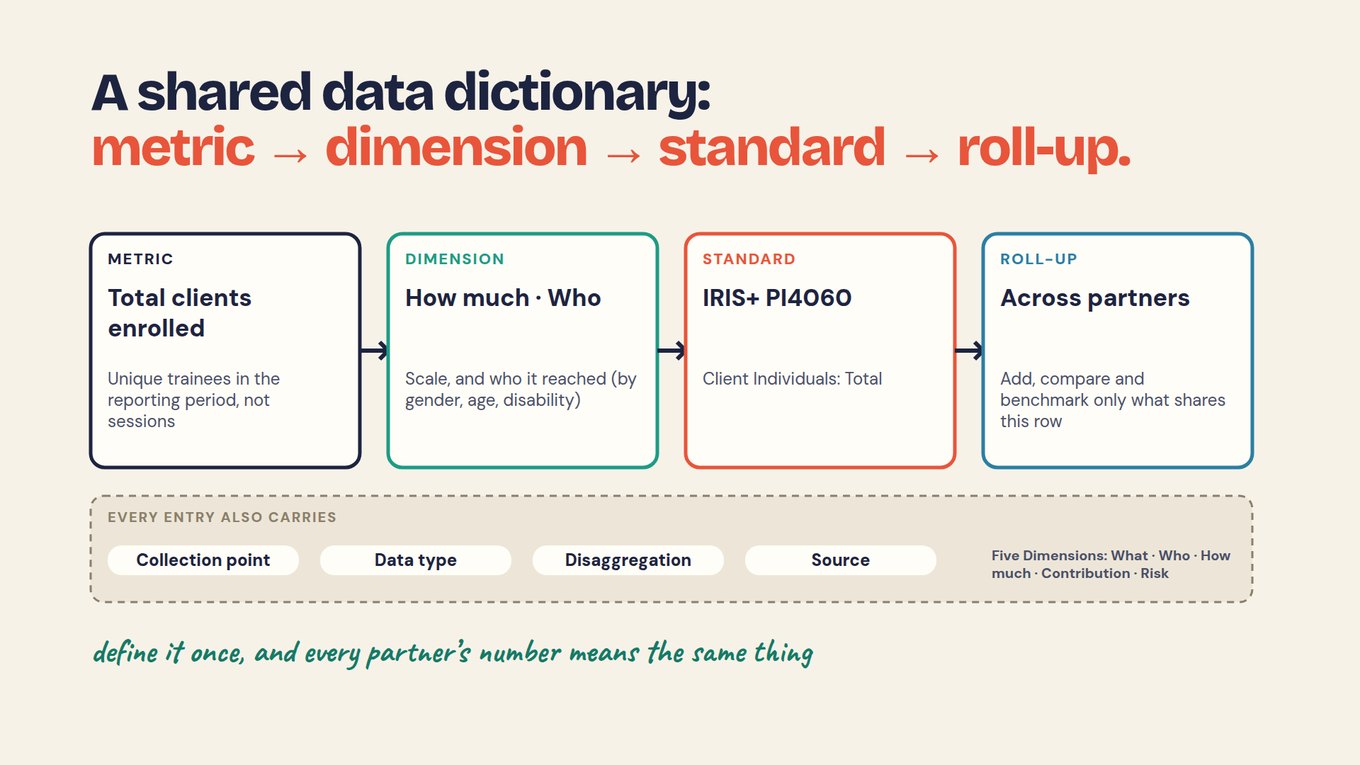
The denominator is where most metric sets go wrong. “Retained” can be out of everyone enrolled, everyone placed or everyone who answered the follow-up, and each tells a different story. Put the denominator in the row, and report the unknowns beside it.
Scroll horizontally to see all columns →
| Field | Retained at 12 months (fictional) |
|---|---|
| Definition | A person placed through the program who is in the same job 12 months later |
| Numerator | Placed people confirmed in the same job at the 12-month follow-up |
| Denominator | Placed people due a 12-month follow-up this year; unknowns shown separately |
| Source and timing | 12-month follow-up survey, linked to the enrollment record by one ID; annual |
| Dimension · standard | How much · Risk · no IRIS+ code |
| Limits | Self-report; people who do not answer |
| Owner | Funder's portfolio manager approves changes |
An AI tool can sort and draft rows from your candidate list. The chapter A shared data dictionary: metric, dimension, standard shows how to test each row on real records.
PROMPT · PASTE INTO CLAUDE, CHATGPT OR YOUR AI TOOL
Below is our program's intended change and a list of candidate metrics.

For each metric:
1. Say whether it is a resource, output, quality, outcome,
   distribution or unintended-effect measure.
2. Tag one or two of the Five Dimensions of Impact
   (What, Who, How much, Contribution, Risk).
3. Draft a dictionary row: plain definition, numerator, denominator,
   collection point, source, disaggregation, missing-value rule.
Then list which dimensions no metric covers.

Rules:
- Do not invent numbers or IRIS+ codes. If I ask for a code, say
  which catalog entry to check and how our definition may differ.
- Where our text is silent, write "not in our data" and a question.
- A missing answer is unknown, never zero.

[PASTE INTENDED CHANGE AND CANDIDATE METRICS]
How do you compare social impact metrics across partners or sites?
Add only numbers that share a definition, and add counts rather than percentages. A number counted a different way is held back and explained, not averaged in.
In the fictional fund, Partners A, B and D report placements within 90 days of exit: 42, 31 and 27, a portfolio total of 100. Partner C reported 55 placed within six months, a different metric, so it is held until C confirms its 90-day count. The chapter Roll up and benchmark portfolio results works through the whole roll-up.
For rates, pool numerators and denominators across partners; an average of percentages ignores how many people sit behind each. Agree the few core fields every partner must share, and let each collect its own local questions beside them.
What can social impact metrics not tell you?
Metrics describe what was delivered and what changed among the people you heard from; on their own they do not prove the program caused the change. A before-and-after rise needs a comparison, such as earlier cohorts or outside data on the same definition, before it is called an effect.
Outcome metrics rely on self-report and follow-ups some people never answer; report those people as unknown, never as a “no”.
Open answers explain the pattern, but a theme counted among people who left comments is not a rate for everyone served. In Sopact Sense, an Intelligence Cell reads each open answer on arrival with a prompt your team configures, and the AI Assistant answers only from the surveys you select, each line linked to a record. People still decide what a finding means.
Start with one metric set for one program
Pick one program and one reader, and build its metric set end to end before adding a second program.
- Write the intended change in one sentence and name the decision the numbers will inform.
- Choose two outputs and two or three outcomes from the tables above, adapted to your work.
- Tag each with the Five Dimensions and note which dimension none covers.
- Write a dictionary row for each, with the denominator and missing-value rule.
- Test each row on five real records and share the rows with every site or partner before the next collection.
After the first cycle you hold a short metric set, one definition per metric that every partner applies, and a written list of the gaps you chose to leave.
Frequently asked questions
Which social impact metrics should we track?
Track the few that answer your decisions: enough delivery and reach measures to explain results, the outcomes the program exists to cause, and important unintended effects. Define each before collecting and drop any metric nobody will use. For job training, that could be enrollment, completion, placement within a set window, retention and starting wage.
Do outcome metrics prove impact?
No. Outcome metrics describe change among the people you measured. Showing that the program caused it needs a comparison, such as earlier cohorts, a comparison group or outside data on the same definition, and an honest account of who did not respond. State the source, coverage, window and limits next to every outcome you report.
How many social impact metrics are enough?
There is no universal number. Use the smallest coherent set that covers your key decisions and risks, and never drop an important negative effect to keep a dashboard short. Five well-defined metrics every site can collect are worth more than twenty that half the sites skip or count differently.
Can social impact metrics change over time?
Yes. Record each change in a change log: date, old and new wording, who approved it, which reports it affects. A changed definition is a new metric, so give it its own row rather than overwriting the old one, and check whether earlier results can still be compared before combining them in one report.
Does SDG alignment validate our results?
No. Naming a relevant Sustainable Development Goal shows which global priority the work relates to. It does not show that the program achieved anything. Your report still needs defined metrics, evidence from your own records and a careful account of the program's contribution, and any IRIS+ code you use should match your definition.
How does Sopact support social impact metrics?
Sopact Sense gives each person one ID from the first form, so enrollment, follow-up and exit answers sit on one record. Folders keep each partner's data separate while the owner sees aggregated results, the AI Assistant answers only from the surveys you select, and every line of an answer links to a record. A context layer for definitions is coming soon.
