What is the Kirkpatrick model?
The Kirkpatrick model organizes training evaluation into four levels: Reaction, Learning, Behavior and Results. It helps teams distinguish the learning experience from acquired knowledge or skills, application in practice and the outcomes the organization wants to achieve.
The framework does not make those outcomes automatic or prove a causal chain between them. A positive reaction does not guarantee learning, and a learning gain does not guarantee workplace application. The evaluation needs suitable measures, context and a plan for interpreting the evidence.
Kirkpatrick Partners' official model guidance emphasizes planning around intended results and the behavior needed to reach them. Use that framework to organize the questions; then design the collection, analysis and review around your actual program.
The four levels, with practical examples
| Level | Question to examine | Possible evidence | Limit to remember |
|---|---|---|---|
| 1 · Reaction | How did participants experience the training? | Relevance, engagement and feedback on obstacles | A favorable response is not direct evidence of competence |
| 2 · Learning | What knowledge, skills or other intended learning did participants acquire? | Appropriate assessments, demonstrations and related self-reports | A final score alone does not establish individual gain |
| 3 · Behavior | Are participants applying the intended behavior? | Work samples, observation and participant or supervisor accounts | Opportunity, support and task conditions affect application |
| 4 · Results | What relevant organizational or program outcomes are observed? | Defined operational or participant outcome measures | Movement in a metric does not alone establish the training effect |
Level 1: Reaction
Ask about the aspects of the experience the team can use. Was the content relevant? Could learners participate? What made practice difficult? A satisfaction score can be useful, but a specific comment about missing practice time may be more actionable.
Choose a brief collection method that fits the event. An end-of-session survey, a short reflection or a structured conversation can work. Avoid turning every reaction form into a broad evaluation of all four levels before learners have had a chance to apply anything.
Level 2: Learning
Match assessment to the learning goal. Knowledge questions, realistic scenarios, demonstrations and work samples provide different evidence. Confidence and commitment can add perspective, but keep self-reported perception separate from observed performance.
A suitable baseline and later assessment can describe matched learning change. A valid final assessment can describe attainment even when no baseline exists. Record the task and rubric version and do not compare incompatible scales as though they measured the same thing. See training assessment for design guidance.
Level 3: Behavior
Define an observable behavior and identify when learners will have a meaningful opportunity to use it. The appropriate interval depends on the task. A frequent service procedure and an annual planning responsibility should not share an arbitrary follow-up deadline.
Combine relevant evidence where feasible: work examples, observation, participant accounts and supervisor feedback. Each source has limitations. Agreement between two sources strengthens confidence but is not automatic proof; both may share blind spots or incentives.
Ask about barriers and support. A learner may know what to do but lack time, permission, equipment or an appropriate assignment. Treat that as information about the conditions for transfer, not simply as an individual failure.
Level 4: Results
Choose outcomes connected to the program's purpose, such as quality, service performance, time to proficiency or an appropriate participant outcome. Define the measure, unit, denominator, period and data source before making a comparison.
Some results belong to a team or organization rather than an individual learner. Do not force an individual-level join when it misrepresents how the outcome occurs. Examine relevant behavior and context alongside the result, and state what the design can establish.
How to apply the model to a real program
- Agree on the intended result. Define the performance problem and check whether training is an appropriate part of the response.
- Specify the behavior and support needed. Identify what people should do and what must make that possible.
- Choose learning evidence. Use tasks and scoring that reflect the relevant competence.
- Plan sources and timing. Assign responsibility for each collection point, including follow-up after the course.
- Define the analysis. Record comparison groups, baselines, denominators, missing-data handling and limits.
- Review and act. Use findings during delivery where useful, and revisit actions when later evidence becomes available.
Do not add a survey simply to fill a level. An existing work record may be a better source than another self-rating. Conversely, a numerical operational measure may need qualitative investigation to explain what people experienced.
A worked example: a digital-skills cohort
The following example is fictional and illustrates an evaluation plan, not a Sopact customer outcome. A ten-week course has 23 participants. The team wants learners to complete a practical setup task and later use the skill in relevant work.
| Stage | Evidence collected | Review question |
|---|---|---|
| Before instruction | A relevant task, scored criteria and confidence self-rating | What is each learner's starting point, and what support may be needed? |
| During practice | Task feedback and comments about barriers | Which parts need clearer instruction or more practice? |
| At completion | A comparable task and reaction feedback | What attainment and matched change can be observed? |
| After an opportunity to apply | Work examples, self-reports and appropriate corroboration | Is the skill being used, and what helps or prevents application? |
| At the agreed outcome review | A defined work or program outcome | What changed, and which alternative explanations remain? |
Suppose all 23 have comparable baseline and final assessments, with a mean score moving from 41% to 78%. That is a 37-percentage-point difference, not 34 points. The team should also inspect the distribution and criterion-level changes rather than relying only on the mean.
Suppose 18 of the 23 later report weekly use of the skill, while five do not provide usable follow-up. The report can say that 18 reported weekly use and five have missing evidence. It cannot conclude that the remaining five did not use the skill. Self-reported use also remains distinct from observed performance.
If two participants describe difficulty with the same module, the team may add practice and examine subsequent work. That is a reasonable improvement decision. The example still does not prove that the practice change caused a later outcome; the evaluation must consider other influences.
Connect the evidence without making everything one survey
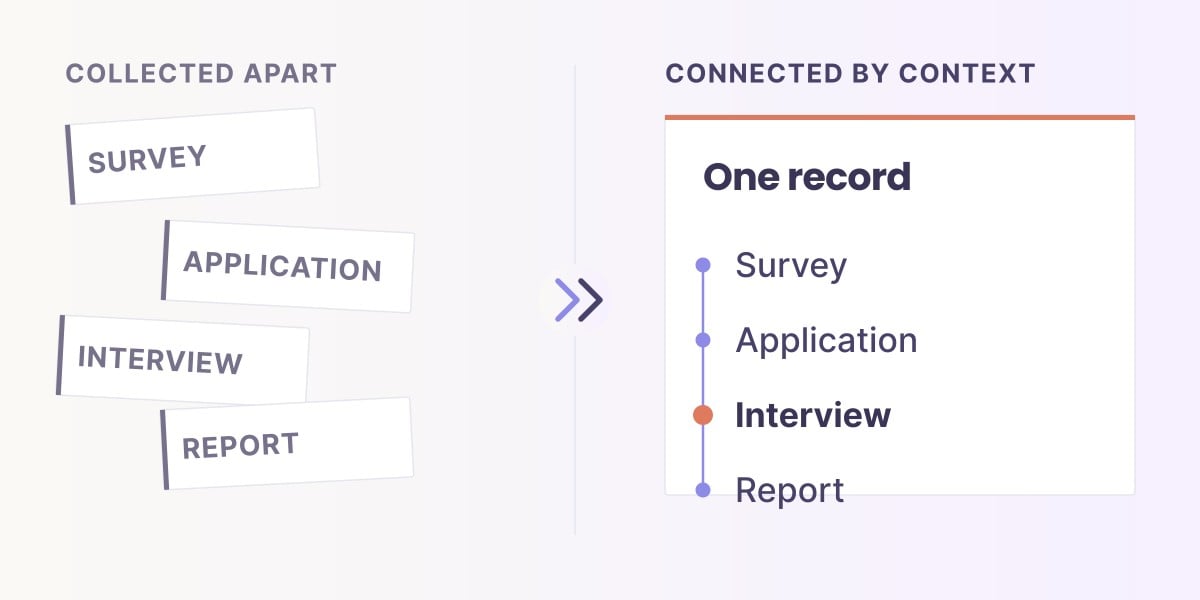
Keep the relevant learner, cohort, date, task version, rubric, source and review decision with each observation. Connect repeated records where the purpose and access rules allow it. Retain unmatched or missing observations instead of forcing a complete sequence.
Different levels may need different sources and units. A reaction survey, observed task and team-level quality measure do not need identical scales. What matters is that their relationship is documented and their meanings remain distinct.
Across locations, agree on common criteria for the comparisons you need and allow local detail where delivery differs. Use a data dictionary to record the shared fields, populations and periods. Collect stable registration context once where appropriate, and date later changes.
Keep personal assessment evidence restricted to its intended audience. A public program summary should not expose individual learner records merely because those records are connected internally.
Support transfer after the course
Training ends before many opportunities to apply it occur. Managers, work conditions, feedback and practice opportunities can affect what happens next. Plan those supports alongside the learning activity rather than treating non-application only as a measurement problem.
Kirkpatrick Partners describes required drivers as processes and systems supporting the desired behavior. In a practical plan, identify who will provide support, what they will do and how the team will know whether that support occurred.
For example, a supervisor might assign a suitable task, review an early attempt and address a resource barrier. Record whether the learner actually had the opportunity to apply the skill before interpreting a follow-up score.
Use Level 4 carefully: results are not automatic attribution
An outcome improving after training is relevant evidence, but other changes may have contributed. A new tool, revised staffing, selection into training or a changing workload can affect the same metric.
When attribution matters, plan an appropriate comparison design and state its assumptions. Randomization, credible comparison groups or other evaluation approaches may help depending on the setting. Qualitative evidence can identify explanations and mechanisms, but does not alone eliminate confounding.
Keep the claim proportional to the evidence. A report can describe observed attainment, application and outcome movement without asserting a proven training effect. A traceable calculation helps reviewers inspect a claim; it does not settle every question about causation.
Kirkpatrick and other evaluation approaches
Choose a framework for the questions it helps your team answer. No framework substitutes for sound collection or interpretation.
| Approach | Useful emphasis | Work the team still needs to do |
|---|---|---|
| Kirkpatrick | Organize reaction, learning, behavior and results | Choose appropriate measures, sources, timing and inference limits |
| Phillips ROI Methodology | Include financial return alongside other evaluation levels | Isolate the relevant effects, value benefits and account for costs |
| Success Case Method | Investigate where an initiative works and what enables or inhibits success | Select and verify cases without treating them as an average effect for everyone |
| LTEM | Examine learning evaluation through a more detailed set of tiers | Collect evidence appropriate to competence and transfer, rather than relying only on participation |
Consult the primary descriptions of the ROI Methodology, Success Case Method and Learning-Transfer Evaluation Model before choosing an approach. Financial return, case-based explanation and learning transfer are related questions, but they are not interchangeable.
Common mistakes when using the four levels
- Treating the levels as proof of a causal ladder. Measure and examine the relationships instead of assuming them.
- Using one survey for every kind of evidence. Match the source to the question and avoid asking about outcomes too early.
- Assuming a zero gain means failure. A learner may begin near the assessment ceiling; examine attainment and task suitability.
- Using a fixed follow-up date for every skill. Time observations around real opportunities and expected outcomes.
- Calling a supervisor account definitive proof. It is another source to assess, not a guarantee of accuracy.
- Ignoring missing follow-up. State coverage and distinguish unknown outcomes from negative outcomes.
- Assuming data linkage solves evaluation. Connected records still need valid measures and an appropriate design.
How Sopact helps make the evaluation manageable
Sopact connects collection, record context, quantitative measures and qualitative evidence. The team can bring assessments, reflections and follow-up together, retain definitions and inspect the sources behind a reported figure.
This can reduce repeated matching, coding and reporting work as cohorts and collection periods grow. The team still owns the measures, review rules and conclusions. A shared record supports the evaluation; it does not make every field comparable or automate a causal claim.
Test one real cohort from collection through reporting. Check task versions, access permissions, missing observations, related documents and how a codebook revision is reviewed. Measure implementation and maintenance effort as well as time spent producing the first report.
Frequently asked questions
Must every program be measured at all four levels?
Choose an evaluation proportionate to the program, decision and available evidence. Do not imply that a higher-level outcome was measured when only reactions or assessments were collected.
When should Level 3 be measured?
When learners have a meaningful opportunity to apply the relevant behavior. Plan timely observations and support, and use further follow-up where duration matters. There is no single interval that fits every task.
Does Level 2 require identical pre- and post-tests?
A matched gain needs comparable measures. Identical tasks may introduce familiarity effects; equivalent tasks need appropriate design. A final assessment can describe attainment even without a baseline.
What is the difference between Kirkpatrick and ROI?
Kirkpatrick organizes four evaluation levels. ROI approaches add financial analysis with benefit valuation and cost accounting. Connecting records does not remove the need to justify attribution and monetary assumptions.
Where can we continue?
Use training assessment for learning evidence, behavior change after training for application, and training effectiveness for the overall judgment.
Watch: connecting training program data end to end
This Sopact walkthrough shows how training program data connects across the full participant journey, from application through certification and job placement. See the Training & Programs solution · Book a custom demo.
Also see: Connecting training evaluation evidence
This Sopact walkthrough illustrates how training evidence can be organized. Use the assessment, coverage and attribution limits in this guide when interpreting the examples.