


Key Improvements
40%
Alignment Ratio of common Impact Goals
25%
Impact data coverage
Measure economic development programs


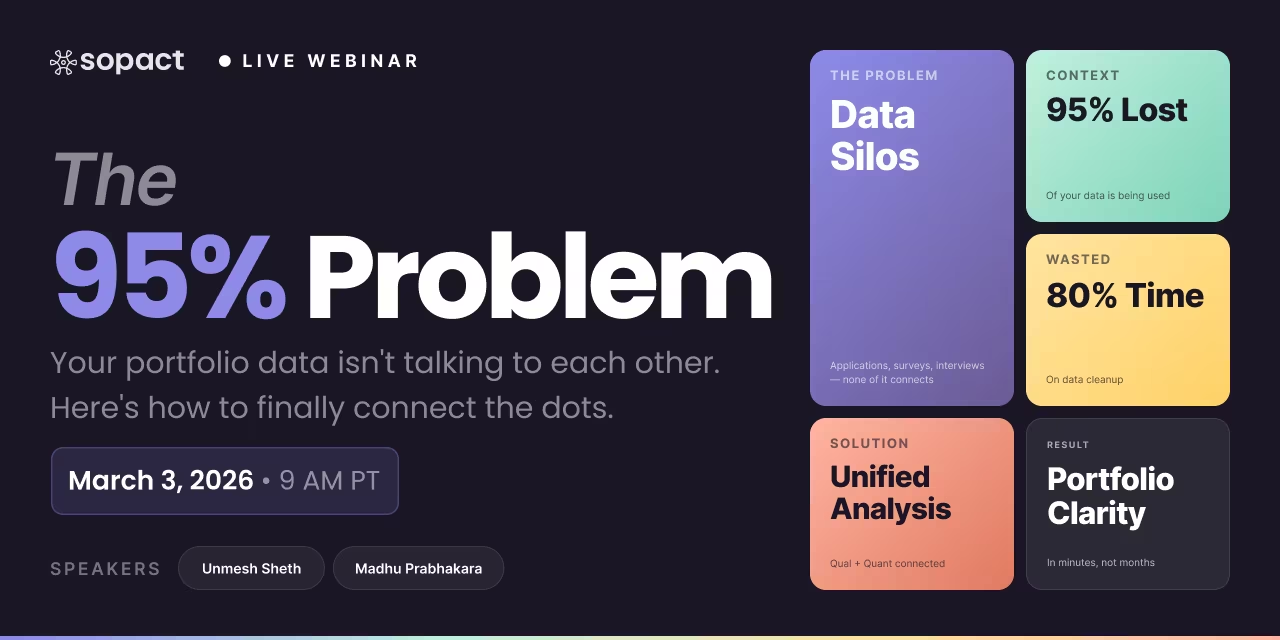
New webinar on 3rd March 2026 | 9:00 am PT
In this webinar, discover how Sopact Sense revolutionizes data collection and analysis.

Audible is the largest audiobook producer and retailer in the United States. Audible is committed to using its platform to make a positive impact on the world and has identified three pillars of business core value: Race, Equity, and Economic Empowerment of the community.
Audible wanted to develop a robust impact measurement process to track its progress towards its goals and make strategic and informed decisions about its programs and initiatives. However, Audible's programs were not aligned to a common goal and their impact data was siloed across multiple systems and difficult to access and analyze.
Audible partnered with Sopact, to develop a comprehensive impact measurement framework. Sopact's Impact Cloud platform helped Audible define their impact indicators and metrics in alignment with their business and impact goals and enabled them to integrate data from multiple sources, including stakeholder surveys, program data, and financial data from internal data sources.
Audible, an Amazon subsidiary company uses an innovative approach to expand its community initiatives to advance equity, racial justice, and economic empowerment that benefits both employees and the community.
Explore Pioneer Post Article (Click)


